Getting Started
This website explain how to use Jzy3D framework to build 3D charts for Java applications.
You will find 3 main sections
- This Getting Started pages, providing code samples to draw your first 3D and 2D charts in Java and configure project to get all dependencies. They are intended for developers willing to get started quickly.
- The User Guide chapters explaining the features of the framework. All code samples demonstrating these features can be purchased here.
- The Developer Guide helps understand the internal architecture of the framework to help developers improving it.
Create your first charts
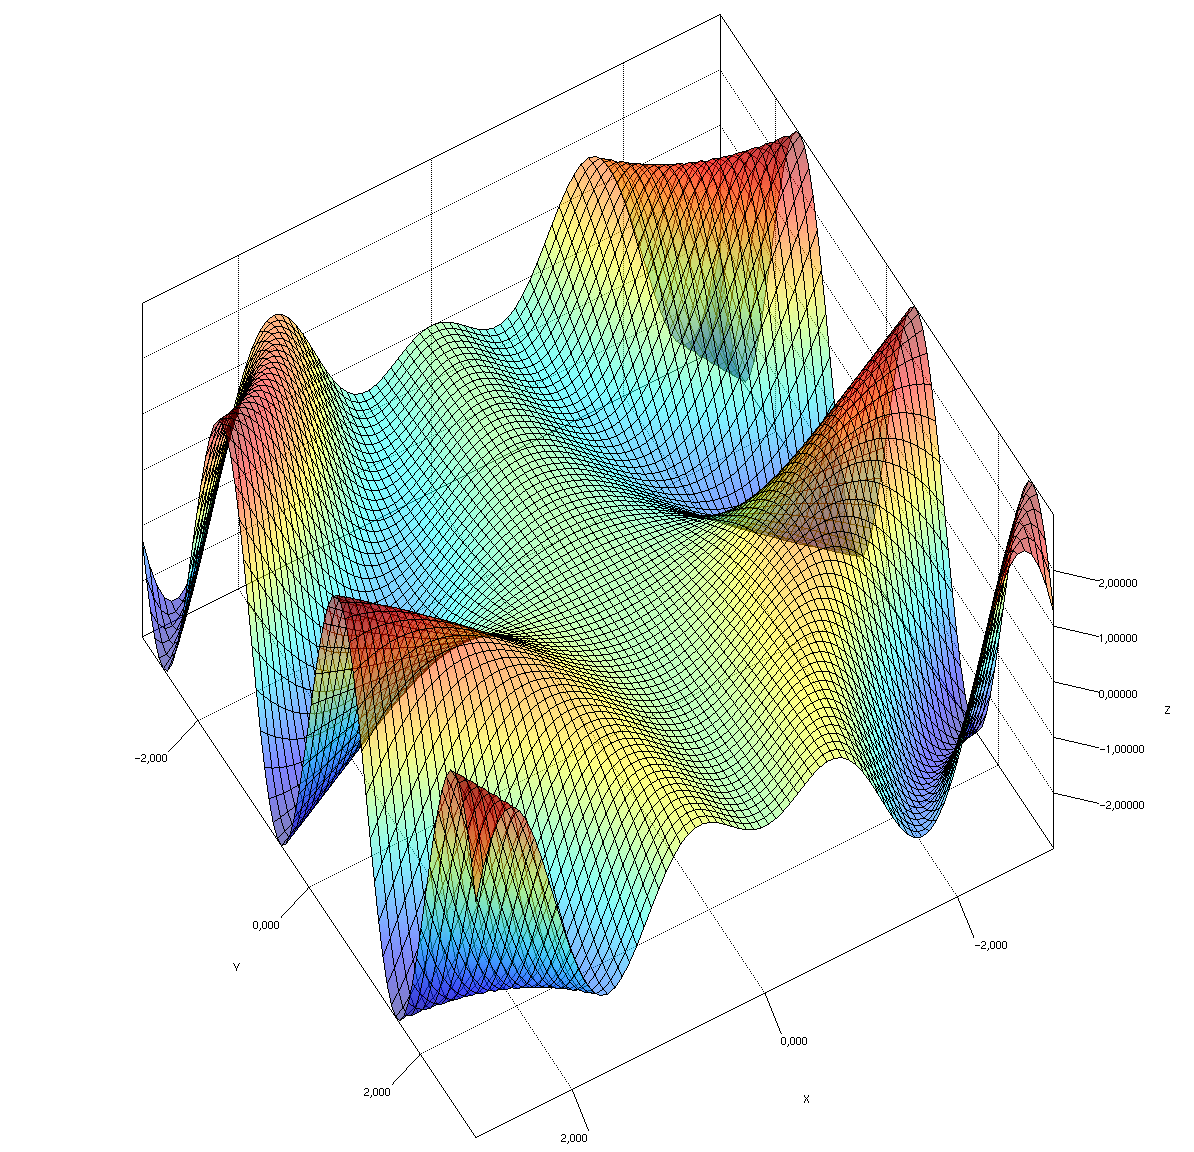
A 3D surface chart
This example can be found in the API tutorial module.
import org.jzy3d.chart.factories.AWTChartFactory;
import org.jzy3d.chart.factories.IChartFactory;
import org.jzy3d.colors.Color;
import org.jzy3d.colors.ColorMapper;
import org.jzy3d.colors.colormaps.ColorMapRainbow;
import org.jzy3d.maths.Range;
import org.jzy3d.plot3d.builder.Func3D;
import org.jzy3d.plot3d.builder.SurfaceBuilder;
import org.jzy3d.plot3d.builder.concrete.OrthonormalGrid;
import org.jzy3d.plot3d.primitives.Shape;
import org.jzy3d.plot3d.rendering.canvas.Quality;

public class SurfaceDemoAWT extends AWTAbstractAnalysis {
  public static void main(String[] args) {

    // Define a function to plot
    Func3D func = new Func3D((x, y) -> x * Math.sin(x * y));
    Range range = new Range(-3, 3);
    int steps = 80;

    // Create the object to represent the function over the given range.
    final Shape surface = new SurfaceBuilder().orthonormal(new OrthonormalGrid(range, steps), func);
    surface.setColorMapper(new ColorMapper(new ColorMapRainbow(), surface, new Color(1, 1, 1, .5f)));
    surface.setFaceDisplayed(true);
    surface.setWireframeDisplayed(true);
    surface.setWireframeColor(Color.BLACK);

    // Create a chart
    IChartFactory f = new AWTChartFactory();
    Chart chart = f.newChart(Quality.Advanced().setHiDPIEnabled(true));
    chart.getScene().getGraph().add(surface);
    chart.open();
    chart.addMouse();

  }
}
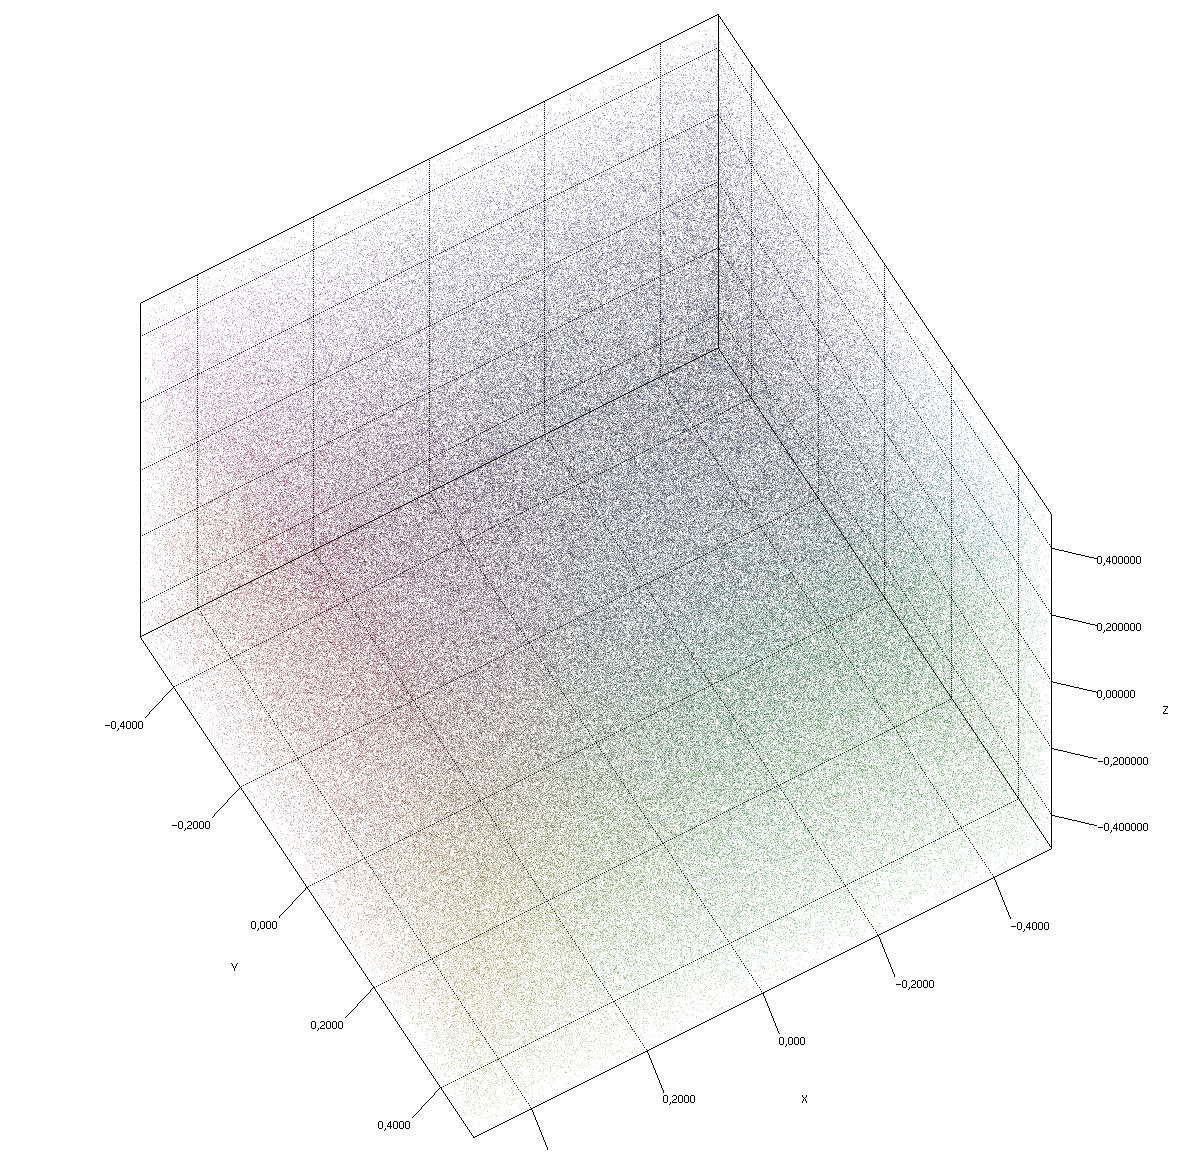
A 3D scatter chart
This example can be found in the API tutorial module.
import java.util.Random;
import org.jzy3d.chart.factories.AWTChartFactory;
import org.jzy3d.chart.factories.AWTPainterFactory;
import org.jzy3d.chart.factories.IChartFactory;
import org.jzy3d.chart.factories.IPainterFactory;
import org.jzy3d.colors.Color;
import org.jzy3d.maths.Coord3d;
import org.jzy3d.plot3d.primitives.Scatter;
import org.jzy3d.plot3d.rendering.canvas.Quality;

import com.jogamp.opengl.GLCapabilities;
import com.jogamp.opengl.GLProfile;


public class ScatterDemoAWT  {
  public static void main(String[] args) {

    // Generate scatter data
    int size = 500000;
    float x;
    float y;
    float z;
    float a;

    Coord3d[] points = new Coord3d[size];
    Color[] colors = new Color[size];

    Random r = new Random();
    r.setSeed(0);

    for (int i = 0; i < size; i++) {
      x = r.nextFloat() - 0.5f;
      y = r.nextFloat() - 0.5f;
      z = r.nextFloat() - 0.5f;
      points[i] = new Coord3d(x, y, z);
      a = 0.25f;
      colors[i] = new Color(x, y, z, a);
    }

    // Create a drawable scatter
    Scatter scatter = new Scatter(points, colors);

    // Open and show chart
    Quality q = Quality.Advanced();
    IChartFactory f = new AWTChartFactory();
    Chart chart = f.newChart(q);
    chart.getScene().add(scatter);
    chart.open();
    chart.addMouse();
  }
}
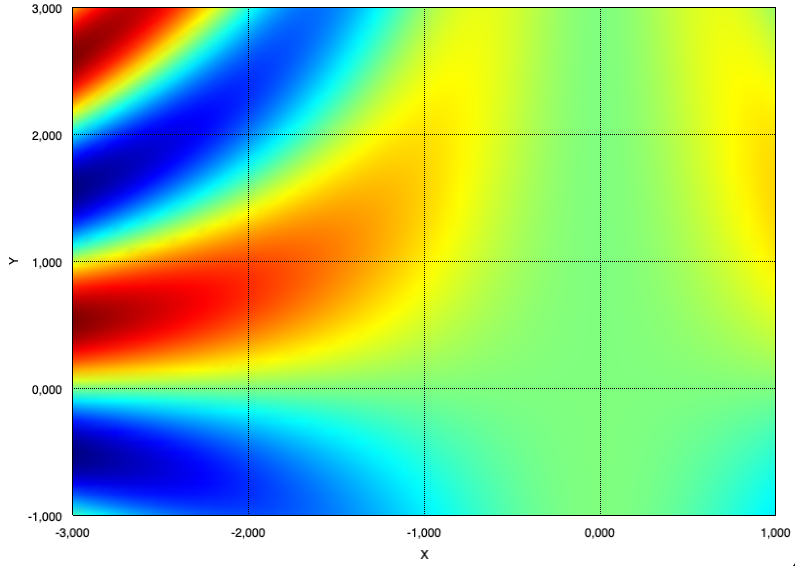
A 2D surface chart
This example can be found in the API tutorial module.
import org.jzy3d.chart.Chart;
import org.jzy3d.chart.factories.AWTChartFactory;
import org.jzy3d.maths.Range;
import org.jzy3d.plot3d.primitives.SampleGeom;
import org.jzy3d.plot3d.primitives.Shape;
import org.jzy3d.plot3d.rendering.canvas.Quality;

public class Surface2D_DemoAWT {
  public static void main(String[] args) throws Exception {
    Shape surface = SampleGeom.surface(new Range (-3, 1), new Range(-1, 3), 1);
    surface.setWireframeDisplayed(false);

    Chart chart = new AWTChartFactory().newChart(Quality.Advanced());
    chart.add(surface);
    chart.view2d();
    chart.open();
    chart.addMouse();
  }
}
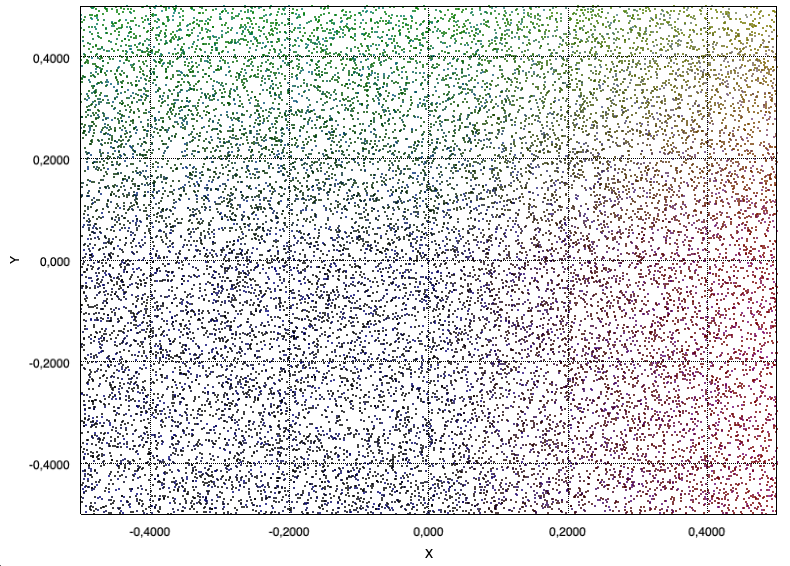
A 2D scatter chart
This example can be found in the API tutorial module.
The SampleGeom class allows generating data in a more compact way than in the 3D example.
import org.jzy3d.chart.Chart;
import org.jzy3d.chart.factories.AWTChartFactory;
import org.jzy3d.plot3d.primitives.SampleGeom;
import org.jzy3d.plot3d.rendering.canvas.Quality;

public class Scatter2D_DemoAWT {
  public static void main(String[] args)  {
    Chart chart = new AWTChartFactory().newChart(Quality.Advanced());
    chart.add(SampleGeom.scatter(20000, 2));
    chart.view2d();
    chart.open();
  }
}