Chapter 3 : Drawables for charts
Surfaces
There are several ways to build a surface:
- providing its mathematical form, with an X and Y range.
- providing input points that should be used to generate the surface polygons.
- providing input polygons that define the surface.
Surface defined by a function
The simplest way of providing data to plot is to implement a Mapper, which basically represents a mathematical function to be used by a GridBuilder. The mapper generates the input coordinates that allow a Tessellator to build polygons :
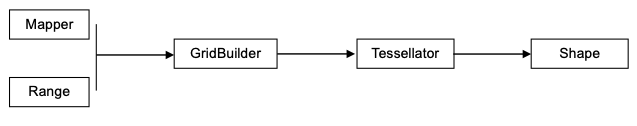
This sequence is wrapped in the SurfaceBuilder class, which is demonstrated in the surface tutorial.
This sequence can be customized by any other strategy as soon as one is finally able to build a collection of Drawable object.
Mappers
A Mapper is an abstract class that requires its method f(double x, double y) to be implemented. The most simple mapper implementation may implement the mathematical function as follow:
Mapper mapper = new Mapper(){
  public double f(double x, double y) {
    return Math.sin(x)*Math.cos(y);
  }
};
Note that although a Mapper let you use double types for x, y and z, the Coord3d structure used by all drawables holds float values. The reason is that float precision is largely sufficient for the purpose of chart rendering, and uses less memory for a large number of Coord3d.
Example Mapper based on an image content
The BufferedImageMapper is a Mapper implementation returning z values computed from the pixel colors of an image, where each {x,y} is a pixel index.
public double f(double x, double y) {
  if (x == Double.NaN || y == Double.NaN)
    return Double.NaN;
  int rbg = image.getRGB((int) x, (maxRow) - ((int) y));
  float red   = (float) ((rbg >> 16) & 0xFF) / 255.0f;
  float green = (float) ((rbg >> 8) & 0xFF) / 255.0f;
  float blue  = (float) ((rbg) & 0xFF)     / 255.0f;
  return ((double) ((red * 0.3f) + (green * 0.59f) + (blue * 0.11f)));
}
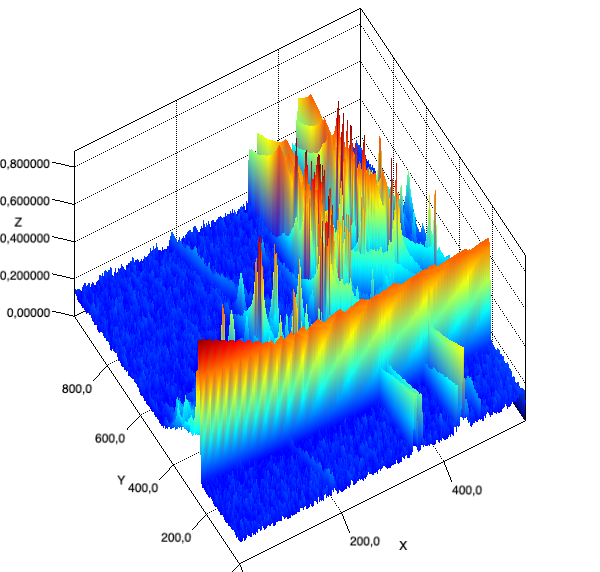
See the ChromatogramDemo in package demos.surface.big.
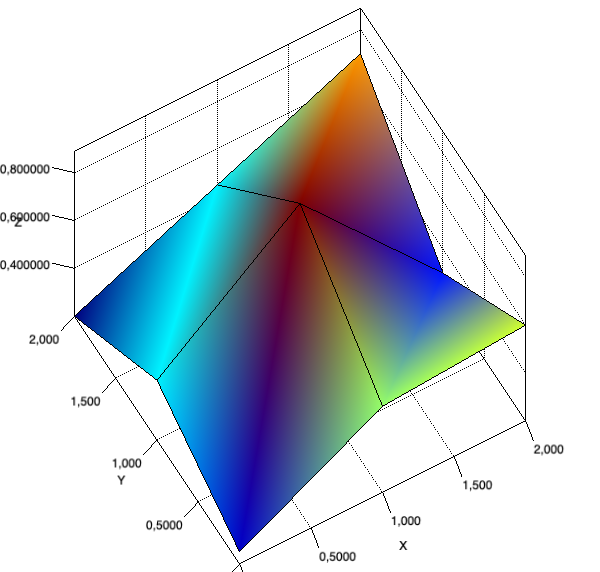
Example Mapper based on surface regression
Svm3d is an extension allowing to define mappers through a set of training points. The green points on the picture below form a training set for a SVM regression model. Once this model is trained, it is able to return a Z value for any point in {X,Y} space:
public double f(double x, double y) {
  return svm.apply(x, y)[0];
}
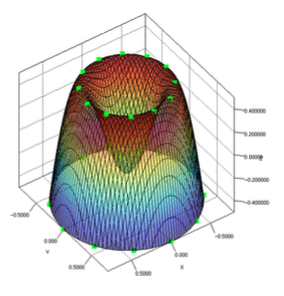
This mapper can be seen as an alternative as using the later mentioned Delaunay tessellator. SvmMapper has the advantage of delivering surface with a user choosen grid with possible high resolution and smooth curves. However it might require spending time on SVM parameter tuning.
Grids
A Grid is able to use a Mapper to generate 3d coordinates. Their actual implementation can generate any mesh as soon as their exist a Tessellator able to handle their output. In the example below, we generate points standing on an orthogonal grid, for an identical X and Y range, with 50 grid steps:
Range xrange = new Range(-150, 150);
Range yrange = new Range(-150, 150);
int steps = 50;
OrthonormalGrid grid = new OrthonormalGrid(xrange, steps, yrange, steps);
Surface defined by input points
Tessellation
Tessellation is the process of creating polygons out of a set of input coordinates. Jzy3d supports several Tessellator strategies as explained hereafter.
Orthonormal tesselation
OrthonormalTessellatoris able to build surface polygons assuming the input data represents nodes of an orthogonal mesh.RingTessellatoris an extention ofOrthonormalTesselatorthat allows “cutting” a surface according to a min and max radius.
Tesselating a surface based on the preceding mapper and grid is simply achieved by calling:
Shape surface = new SurfaceBuilder().orthonormal(grid, mapper);
or
Shape surface = new SurfaceBuilder().ring(grid, mapper, 20f, 50f);
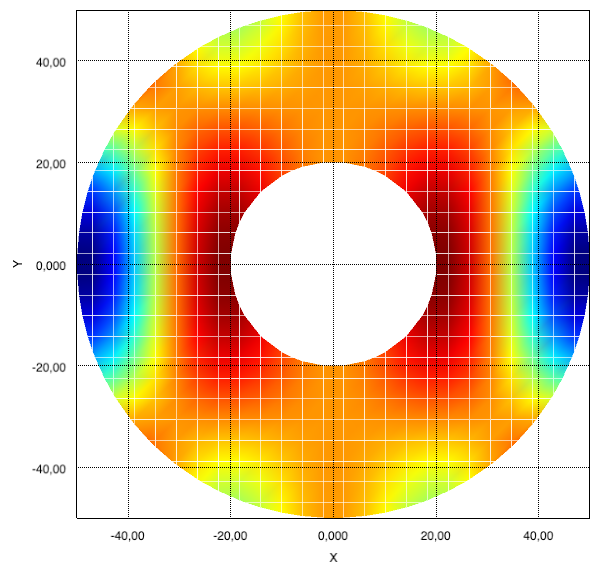
See BookTesselationRing
One may also build surfaces dedicated to large datasets. These are built using CompileableComposite, a drawable object able to compile itself as an OpenGL display list, and then make use of this prebuilt GL code for all following rendering:
Shape surface = new SurfaceBuilder().orthonormalBig(grid, mapper);
See ChromatogramDemo
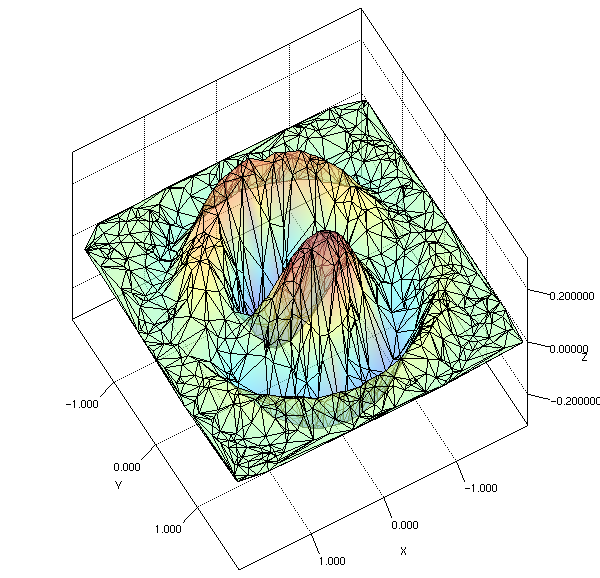
Delaunay: a constraint free surface tessellator
One may require to build a surface using a random set of points. For this use case, a Delaunay tesselator has been implemented using JDT to compute the tesselation of an unordered set of points.
Delaunay algorithm, which details won’t be covered here, is able to compute a good triangulation for points given as follow:
See IncrementalDelaunayDemo in the demos.surface.delaunay package.
Surface defined by polygons
You can build any shape by defining raw polygons by yourself as shown in the bellow code:
double [][] mesh = new double[][];// 3x3
List<Polygon> polygons = new ArrayList<Polygon>();
for(int i = 0; i < mesh.length -1; i++){
  for(int j = 0; j < mesh[i].length -1; j++){
    Polygon polygon = new Polygon();
    polygon.add(new Point(new Coord3d(i, j, mesh[i][j]) ));
    polygon.add(new Point(new Coord3d(i, j+1, mesh[i][j+1]) ));
    polygon.add(new Point(new Coord3d(i+1, j+1, mesh[i+1][j+1]) ));
    polygon.add(new Point(new Coord3d(i+1, j, mesh[i+1][j]) ));
    polygons.add(polygon);
  }
}
Shape surface = new Shape(polygons);
It is important to have only one Shape referencing a given list of polygons. Indeed, each polygon point holds its own color data, so when a Shape is modified by a color tool, each polygon’s point has its color field updated.
See BuildSurfaceDemo
Scatters
Scatters are simple drawables coming in several flavors:
Scatter: a scatter plot made of a single color, usingCoord3d[]andColor[]as data modelMultiColorScatter: a scatter plot painted by aColormap, usingCoord3d[]as data modelMultiColorScatterList: a scatter plot painted by aColormap, usingList<Coord3d>as data model
The below code let you create a simple RGB scatter:
Coord3d[] points = new Coord3d[size];
Color[] colors = new Color[size];

for(int  i=0; i<size; i++){
  x = (float) Math.random() - 0.5f;
  y = (float) Math.random() - 0.5f;
  z = (float) Math.random() - 0.5f;
  a = 0.25f;
  points[i] = new Coord3d(x, y, z);
  colors[i] = new Color(x, y, z, a);
}
Scatter scatter = new Scatter(points, colors);
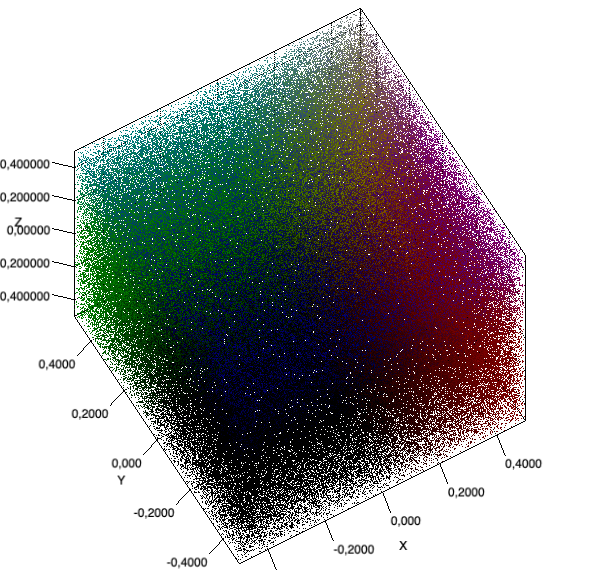
See ScatterDemo, ScatterVBODemo, MultiColorScatterDemo, Scatter2D_EmulGLDemo, ScatterSphereDemo, ScatterCubeDemo
Histograms & bar charts
Bar charts can be build easily using HistogramBar, which is basically a Composite made of one Tube and two closing Disk. The below code shows how to create drawable bars:
HistogramBar bar = new HistogramBar();
bar.setData(new Coord3d(x, y, 0), height, 10, Color.random());
bar.setWireframeDisplayed(false);
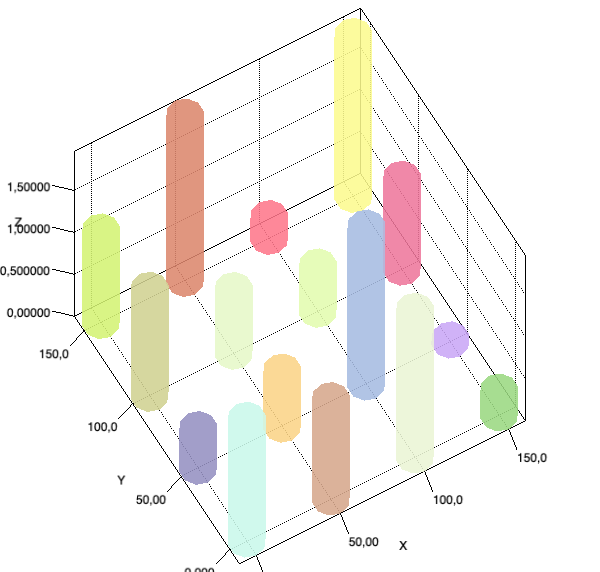
See HistogramDemo, HistogramLightDemo