Chapter 1 : Charts
Main components
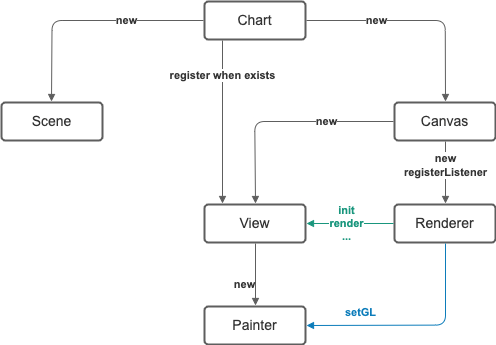
A Chart is a convenient object gathering what you need to plot and control 3d content easily:
- a
Scene, backed by a sceneGraph, that storesDrawableobjects. - a
View, that handles the scene layout and annotations: axes, tooltips, post renderers, background image, etc. The defaultViewhas children classes that are also able to manage several image sources (Open GL scene, Java 2D colorbars, etc) to be laid out in a singleCanvas.
Adding an drawable to the scene graph is made through
chart.getScene().getGraph().add(drawable);
Which can also be made through
chart.add(drawable);
Accessing the view to customize the chart appearance is made with
View view = chart.getView();
Quality
The chart’s Quality let you configure the tradeoff between the performance and the quality of your chart. Chart’s Quality is configured in its constructor and can’t be changed at runtime. Four quality modes are available:
Fastest: No transparency, no color shading, just uses the depth buffer.Intermediate:Fastest+ Color shading, usefull for interpolated colors on polygons.Advanced:Intermediate+ Transparency (Alpha blending + polygon ordering in scene graph). Note: depth buffer is desactivated.Nicest:Advanced+ Anti aliasing on lines and polygons’ wireframe.
HiDPI is supported by default but can be turned off via the Quality setting.
Quality is also used to define wether the chart should render continuously or on demand. One can disable
the default continuous rendering by calling:
quality.setAnimated(false);
One can trigger rendering manually using any of the following method which are equivalent:
chart.render();chart.getView().shoot();chart.getCanvas().forceRepaint();
Initializing charts
Chart factories allow initializating charts for a target windowing toolkit or for a given kind of chart.
Chart initialization let you define its Quality and the target windowing toolkit of its canvas. To setup your desired mode, simply build the chart as follow:
IChartFactory factory = new AWTChartFactory();
Chart chart = factory.newChart(Quality.Advanced());
Factories for Windowing toolkits
Supported windowing toolkits are AWT, Swing, SWT, Newt, JavaFX (up to 1.*) or Offscreen. The existing factories are referenced below
| Toolkit | Processor | Factory |
|---|---|---|
| AWT | GPU | AWTChartFactory |
| Swing | GPU | SwingChartFactory |
| SWT | GPU | SWTChartFactory |
| JavaFX | GPU | JavaFXChartFactory |
| None | GPU | OffscreenChartFactory |
| AWT/Swing | CPU | EmulGLChartFactory |
Factories for dedicated charts
Other factories deliver charts with dedicated components, such as ContourChartFactory, which has a custom AxisBox named ContourAxisBox able to draw contour level on its ground face. Most factories for custom charts stand in the extensions of Jzy3D.
Destroying charts
To safely destroy all resources that may be held by a chart, it is recommended to call the dispose() method of the chart that will in turn call the dispose() method of all its children. This ensures all listeners get unregistered, all thread are stopped and all OpenGL resource get released.
Next section will discuss how to add basic drawable objects to the chart. If you want to immediately draw surface, scatter, or bar charts, then you may go to chapters Drawable for charts.