Chapter 5 : Layout
The chart layout is controlled at three levels:
- the view layout, that lets you set various stretching policies, background settings, tooltips and post renderers for the chart object.
- the canvas layout, that lets you arrange several 3d and 2d views.
- the axe layout, that lets you define tick values and labels for each axis.
View Layout
Jzy3d provides controls that let you improve the rendering of the 3d scene in its parent canvas. For all following settings, you can activate the display of a debug grid to understand how the viewports are actually displayed by OpenGL.
BookMaximizedOff shows how to enable the screen grid for a simple chart :
The default GL scene window is a square that will try to occupy be the largest possible space. If the target panel is not a square, the scene will remain centered on the widest dimension.
Maximize
One can let the chart span on the complete width of the embedding panel.
BookMaximizedOff shows how to maximize the chart along the width :
Squarify
Squarifying is an automatic scaling that lets a complete scene fit into a cube, whatever the X, Y and Z range. This is the desired behavior in most cases, but one may prefer to keep the axes unscaled.
BookSquaredTrue : scaled chart |
BookSquaredFalse : unscaled chart |
 |
 |
Orthogonal and perspective projections
One can specify a projection mode, either orthogonal or perspective. Although most of the scientifical plots use an orthogonal projection (default), plotting with a perspective lets you give more importance to what stands in front of the viewpoint. To enable a specific projection, see BookPerspective demo.
Viewpoint
The camera is always looking at the center of the scene and rotate around this central point.
The viewpoint, i.e. the position of the Camera is defined by a polar coordinate relative to the center of the scene where :
- The first dimension, azimuth, is the horizontal angle in [0;2*π]. An angle out of this range will be truncated to fit in this range (angle = angle % 2*π).
- The second dimension, elevation, is the vertical angle in [-π/2;π/2]. An angle out this range will be reset to the upper bound (π/2) or lower bound (-π/2).
- The third dimension, distance, is the distance from camera to center. It is adjusted by the View to let the scene fit in the display.
View modes
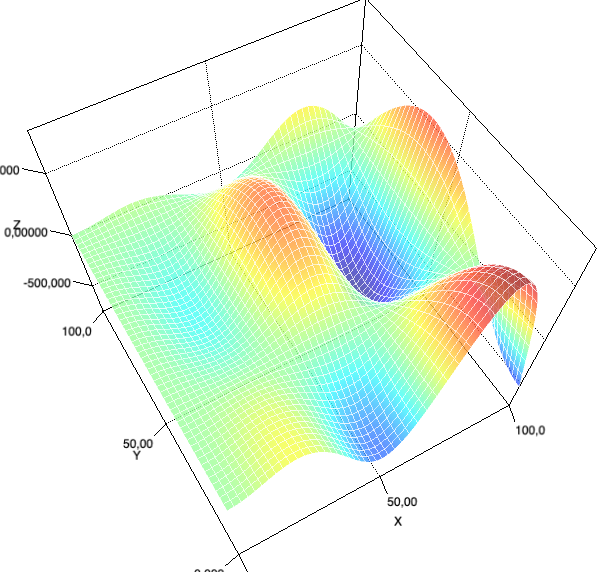
The default way of looking at a 3D chart is turning the camera around the center of the scene.
The view can be constrained to only support specific viewpoint change. One may for example use PROFILE to allow rotation only around the Z axis when using the mouse, and keep X and Y axis rotation to 0.
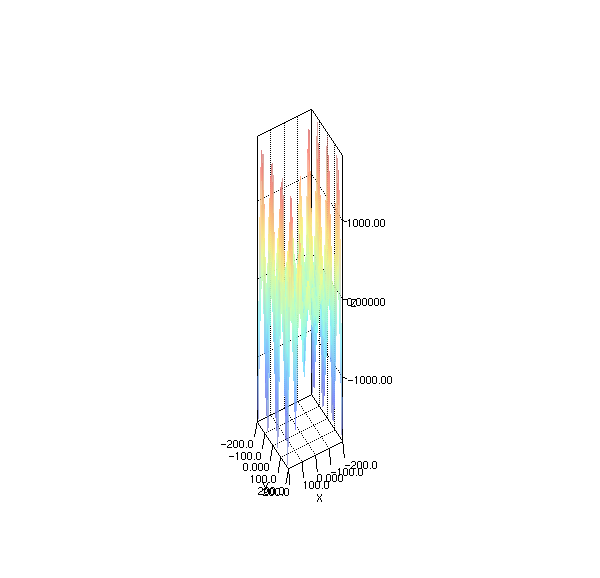
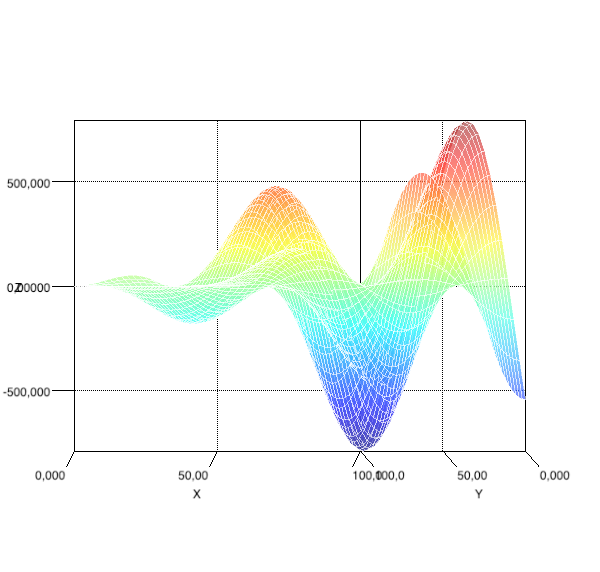
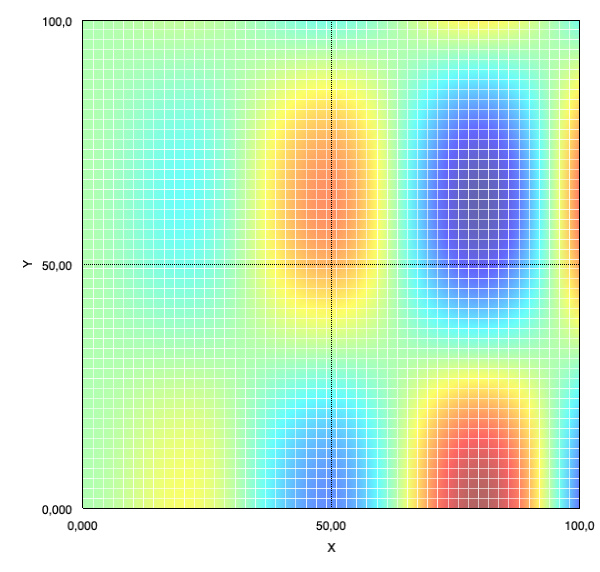
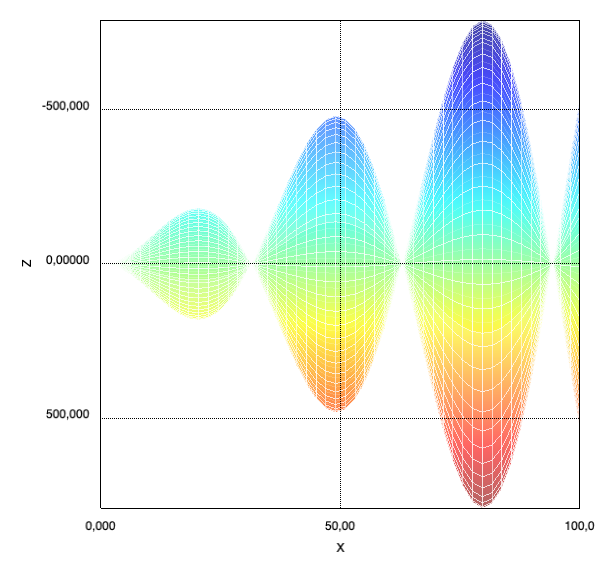
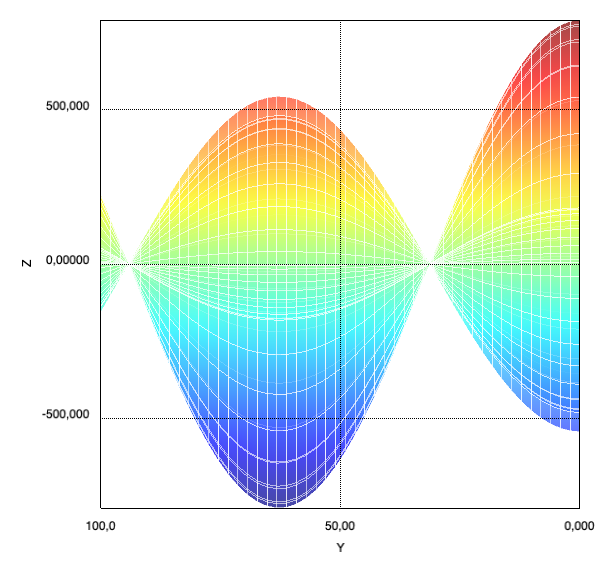
The view can be limited to 2D on either the XY, XZ or YZ dimensions.
BookViewProfile shows how to lock elevation while rotating around Z axis |
BookViewXY shows how to build an XY 2D chart |
 |
 |
BookViewXZ shows how to build an YZ 2D chart where the vertical axis is flipped |
BookViewYZ shows how to build an YZ 2D chart where the horizontal axis is flipped |
 |
 |
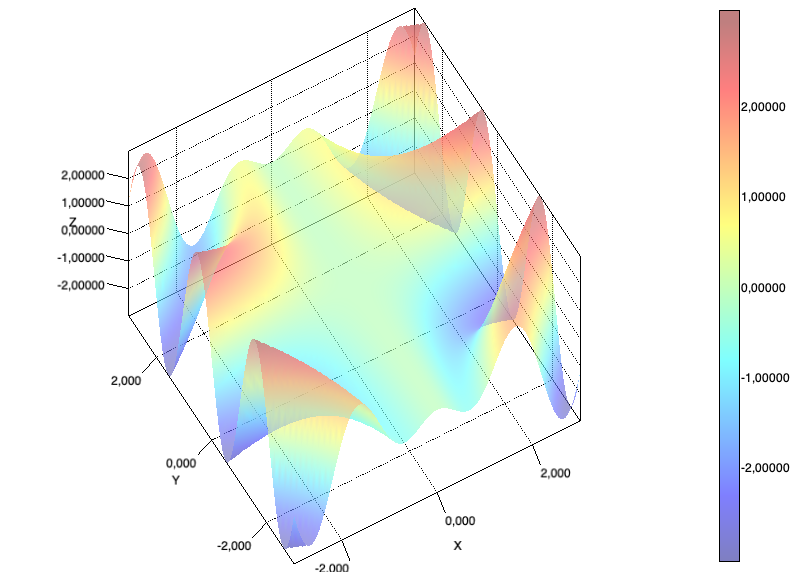
Colorbars
BookColorbar shows how to attach a colorbar to a surface object so that it can be layed out by the view on the right side of the chart.
Colorbar can have
- the bar width configured
- the margin configured (i.e. the white space size in pixel between the canvas border and the colorbar border).
- use the axis font name and size by default, but can be re-configured.
- use the Z axis tick provider and renderer by default, but can be re-configured.
The colorbar width grows according to the bar width, text width and horizontal margins of the colorbar.
If multiple surface have a colorbar, then all the colorbars are displayed.
Post renderers
One can add 2D post renderers on top of a 3D chart using a Java Graphics2d instance.
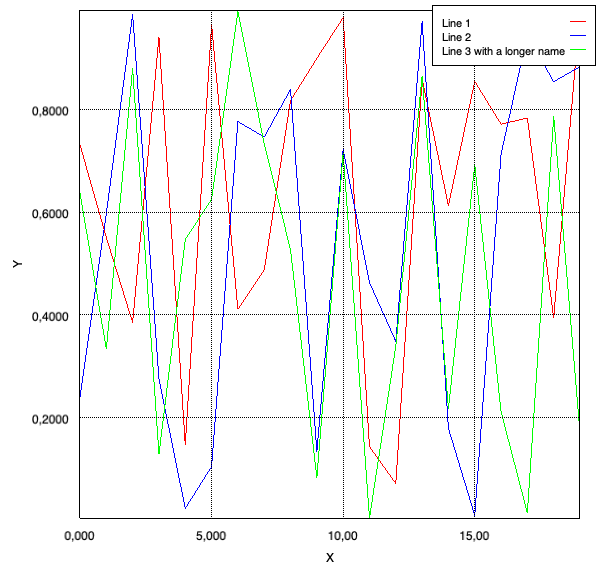
Legends
One can add legends describing the content of the chart.
BookOverlayLegend demonstrates how to define a legend for a line chart, where the following layout settings can be configured :
- Corner of the legend (top left, bottom left, top right, bottom right)
- External horizontal and vertical margins (distance from legend border to canvas border)
- Internal horizontal and vertical margins (distance from text to legend border)
- Font size and style
- Number of pixels between each line
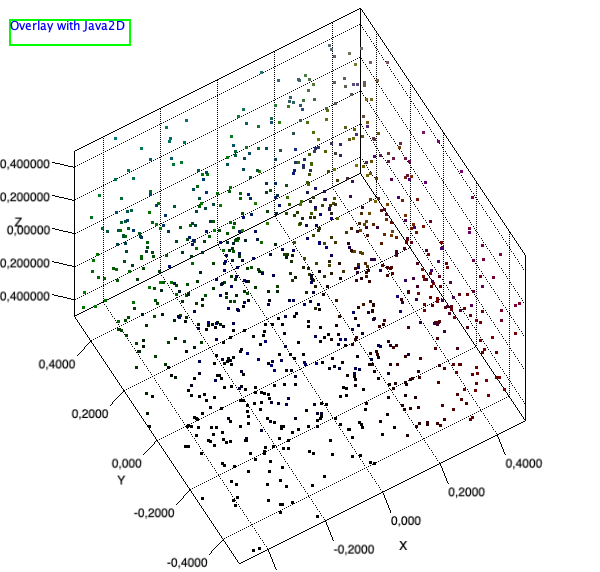
Custom post renderers
BookOverlayCustom demonstrates how to use simple Java Graphics2d instruction to draw content on top of the 3D chart.
Tooltips
BookTooltip shows how to create tooltips to annotate 3D points in the chart.
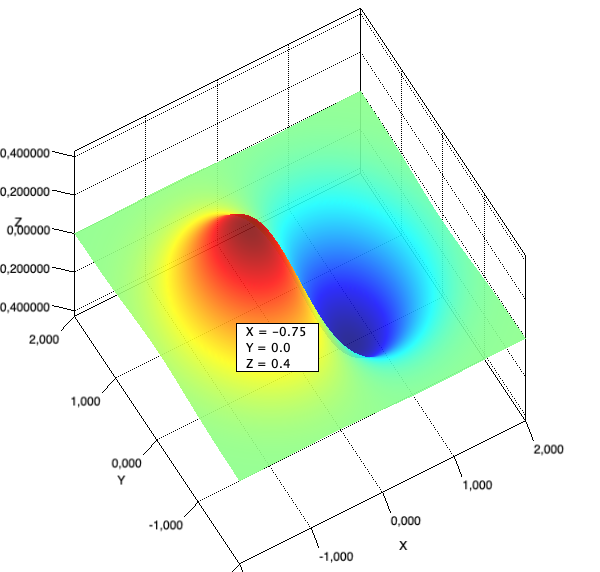
Chart colors
The background color can be changed as follow :
chart.getView().setBackgroundColor(Color.BLACK);
The main color can be changed as follow :
chart.getView().getAxe().getLayout().setMainColor(Color.GRAY);
Axis Layout
The View comes with a box embedding the scene with value annotations. The box can be turned on/off by using:
chart.getView().setAxisBoxDisplayed(false);
One can access the AxisLayout that gathers, for each X, Y, Z axis:
- all labeling policy settings (axis label and tick label properties) defined by
ITickRenderers. - all ticks to render defined by
ITickProvider. - grid and face colors.
A concrete ITickProvider must implement generateTicks(float min, float max, int steps) that returns an array of values indicating selected ticks for the axis range.
Here are the already existing tick providers:
- RegularTickProvider generates a fixed number of ticks in any range.
- SmartTickProvider generates a readable number of ticks (between 3 to 5).
- StaticTickProvider holds a list of tick to display, whatever is the actual view range.
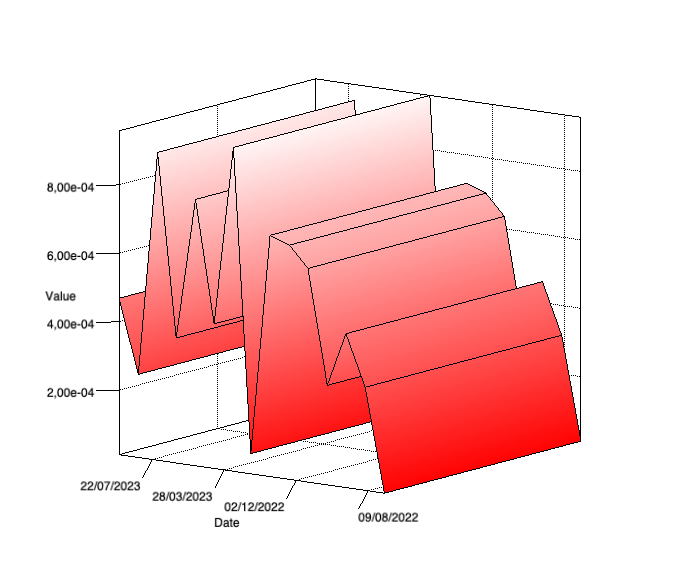
A concrete ITickRenderer must implement format(float value). Here are the already existing tick renderers:
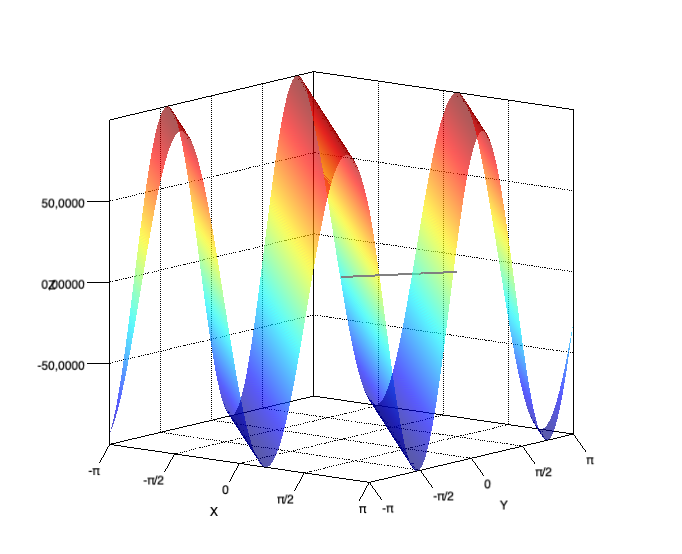
DateTickRendererrenders a tick value as a date, according to a desired date format.ScientificNotationTickRendererrenders a tick value like “1.5e-03”.FixedDecimalTickRendererrenders a tick value with a predefined precision.TrigonometricTickRendererrenders a tick value as a multiple of π.
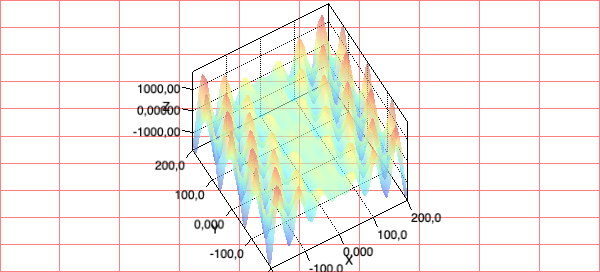
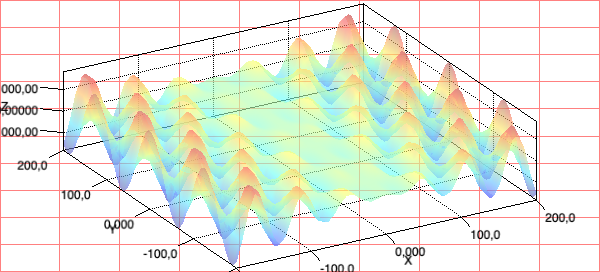
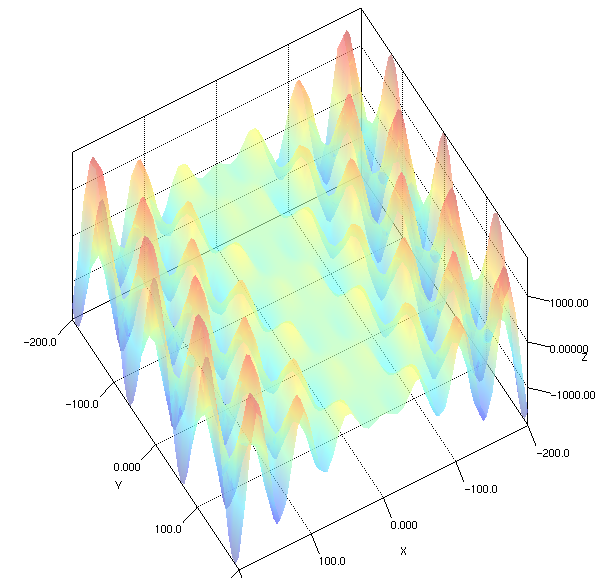
BookAxisLayout shows how to use a date renderer and a scientific notation renderer
Demonstration of trigonometric tick renderers :