Chapter 4 : Colormaps
The API provides a set of Colormaps that can be used to paint objects that implement IMultiColorable (i.e. almost all primitives). There are a few objects with different roles:
• Colormaps are functions that generate a RGBA color for a given XYZ point.
• A ColorMapper applies a Colormap to an object with a given Z range.
• A AWTColorbarLegend draws the Colormap, next to the chart, with tick annotations.
The framework already provides the following colormaps:
| Name | Colormap |
|---|---|
| ColormapGrayscale |  |
| ColormapHotCold |  |
| ColormapRainbow |  |
| ColormapRGB |  |
| ColormapRedAndGreen |  |
| ColormapWhiteBlue |  |
| ColormapWhiteGreen |  |
| ColormapWhiteRed |  |
A colormap basically implement:
public Color getColor(IColorMappable colorable, float x, float y, float z)
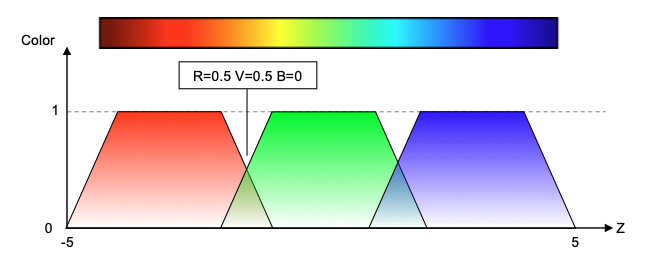
The below schema shows how a colormap computes a color based on the three RGB components: each component exists in a given Z range and is added to all other components to produce a color.
Note that a colormap direction can be toggled by calling:
colormap.setDirection(false)
Apply a colormap to a drawable
A ColorMapper let you apply a Colormap to a MultiColorable object. It needs to know the Z range to be used in order to span the Colormap colors. Any point or polygon standing out of that range will have the «lowest color» under the minimum Z value, and «highest color» above the maximum Z value.
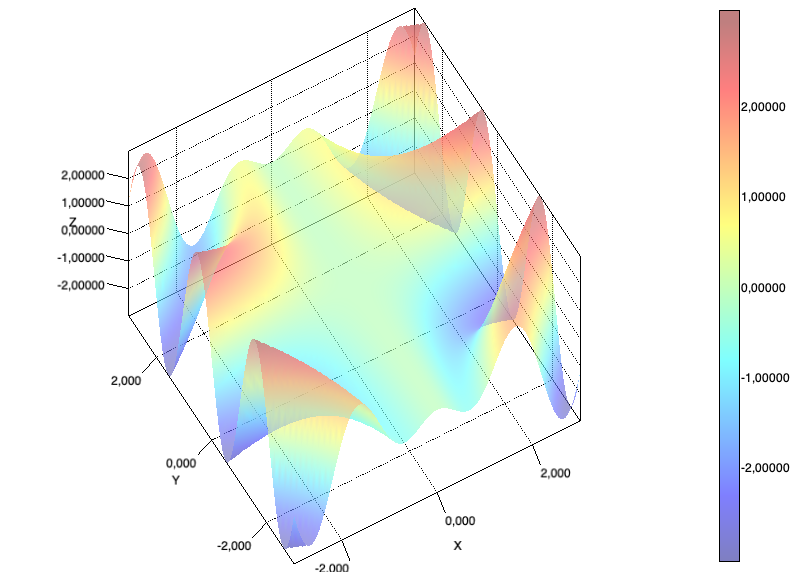
surface.setColorMapper(new ColorMapper(new ColorMapRainbow(), -5, 5));
A ColorMapper also supports a color factor enabling to multiply all colormap colors with a color. It is especially usefull to apply an alpha effect as follow:
ColorMapper mapper = new ColorMapper(new ColorMapRainbow(), -5, 5, new Color(1,1,1,.5f))
Create a colorbar
When painting an object with a Colormap and ColorMapper, you will probably wish to have this colormap represented by a colorbar. This is the purpose of the AWTColorbarLegend object that keeps track of the object scale changes, and that remains cleanly layed out by the ChartView.
BookColorbar shows how to add a colorbar to a chart :
Additionally, the colorbar can be given an ITickProvider and ITickRenderer (usually those already defined to configure the AxisBox) to generate a BufferedImage with tick annotation next to the colorbar.
The roles of ITickProvider and ITickRenderer are given in the Axis layout section. Additional information on the ChartView layout are given in the View layout section.